While most climate-oriented planning and action will be focused on trees, the implementation of key decisions can be shaped by considerations of human health. In some communities, attention to the human health improvements that trees and nearby nature provide can help to build the case for support of urban forestry programs and activity. In addition to climate response, human health answers the questions of ‘why’ community resources should be dedicated to tree planning, planting and maintenance.
The dialog about health is changing. Concerns about disease and illness once focused on individuals – one’s genetics and lifestyle choices. Public health and medical officials now acknowledge the powerful influence of social determinants, meaning the conditions of one’s life that affect health, that may have more impact, such as quality of housing, health care access, and education and employment opportunities.
The urban forest and nearby nature are social determinants of health! Decades of research point to the positive health outcomes of nature experiences in cities, and the reductions in wellness associated with the absence of urban greening. Recent research notes disparities in urban forests and parks, and a common pattern of less or no green space in socially disadvantaged communities.
Assessing Human Health Trends and Vulnerabilities
What human health trends and vulnerabilities are most important in your project area? Collecting new health data about a project may not be feasible due to time or budget. Yet data are often readily available to learn about the human health concerns at multiple scales. You can quickly do an online search to locate resources and generally interpret them to understand local health concerns and vulnerabilities.
There are also data resources at the national level. The CDC (U.S. Centers for Disease Control and Prevention) collects health data using surveys and other inputs, and is a remarkable resource for maps and data concerning health, often reported at the county level. In addition, the EPA (U.S. Environmental Protection Agency) has created the EnviroAtlas platform which presents 400+ datasets in an interactive format, which include environmental risks, human health influences, and climate projections from NASA.
State health departments usually have comprehensive information about morbidity (disease incidence) and mortality (death by cause) across the state, and often report their findings by county (some even to the Census tract level). This information provides a broad scale list of issues and highlights major trends. Some states, such as Washington, also present this information in terms of specific socio-economic conditions and vulnerabilities.
At the local government scale, most counties have a health department. Some of these also collect and report data on health trends more specific to a jurisdiction, as they may access hospital records or have set up indicator systems. Reporting may be county wide, and even break down by Census tract. Some cities have used Census tract data to assess disparities in human health, and may even have mapped this across neighborhoods. Indicators are reported as life expectancy or specific illnesses (such as asthma or heat-related hospitalizations).
Some of the national, state, and county data may be parsed right down to the neighborhood or project scale. Local universities may have conducted studies or published data for local jurisdictions and neighborhoods. Some urban planning projects trigger a Health Impact Assessment, an intensive review of multiple human indicators for a specified community.
Integrating Tree Equity
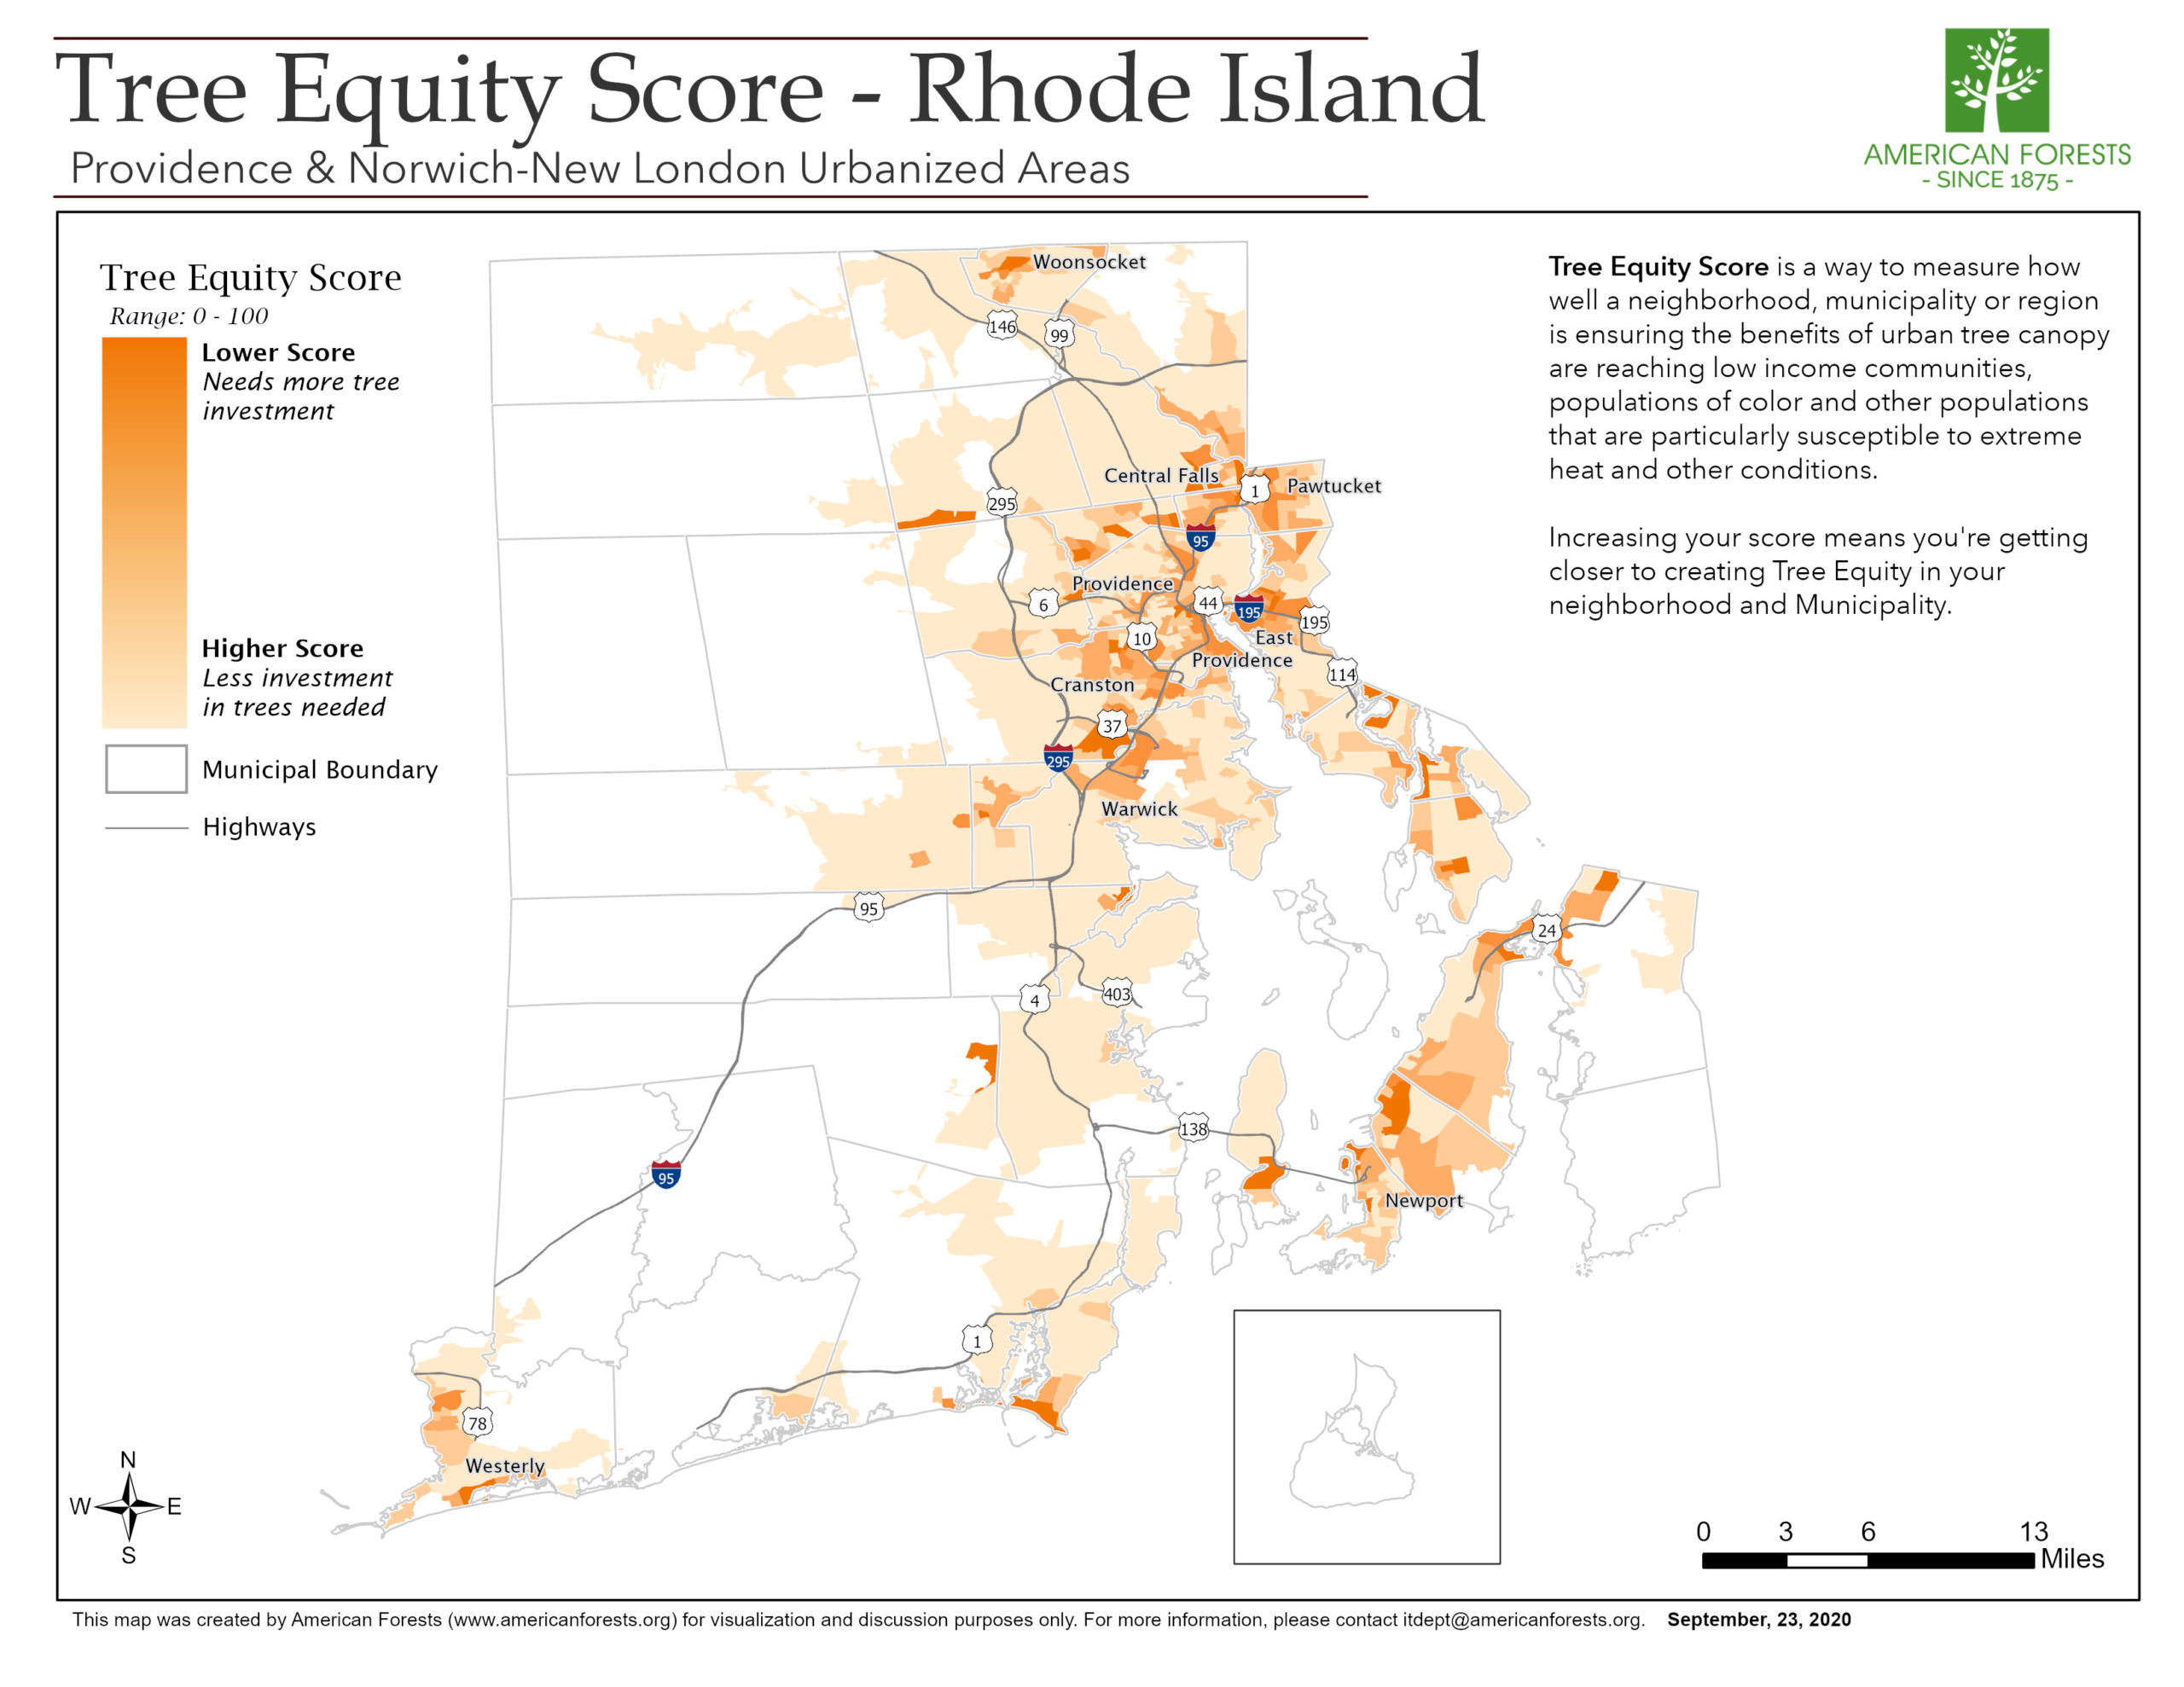
Urban tree cover is often highly variable across a city, and forestry programs and activities can help address health disparities across underserved populations, as well as inequities in the distribution of trees and green spaces across communities. The Tree Equity Score is a free science-based interactive tool that helps users identify needs for increasing tree cover at a neighborhood scale as a way to address social inequities so that people can thrive. The tool can help identify areas where people are most susceptible to extreme heat and other environmental conditions and inform efforts to prioritize tree planting in neighborhoods with low canopy cover.
Do It Yourself!
- Determine geographic scope of tree project, such as site or parcel scale to watershed to city or county.
- Prepare a map overlay (conceptual or GIS tools) to understand intersections of your project with human communities and populations.
- Conduct an assessment of human health concerns and vulnerabilities using relevant existing data (or original data collection) and represent these geographically or symbolically on the map or as narrative.
- Assess potential climate-influenced events or environmental conditions that may impact human health and represent these geographically on the map or symbolically as narrative. These may include coastal or river flood zones, neighborhoods more likely to experience extreme heat, areas with heightened air quality issues, or landscapes with higher wildfire risk.
- Consider how to plan the tree project (or even relocate it) to respond to specific, prominent or urgent human health concerns and vulnerabilities.